.png) Get Started
Get Started
Support teams usually know when users are frustrated. A Discord thread turns tense. Telegram replies get shorter. Web chat transcripts start with “following up again.” The team feels the pressure, works hard, clears queues, and still can't answer the one question leadership asks next: are customers happier than they were last month?
That gap is where customer satisfaction metrics matter.
For community and support teams, especially those handling public and private conversations across multiple channels, instinct stops being enough very quickly. A handful of memorable complaints can distort priorities. A flood of “thanks” messages can hide broken workflows. A queue that looks under control can still produce an experience that feels slow, repetitive, and expensive for the customer.
The useful shift is moving from anecdotal confidence to measurable signals. Not just a single score, either. The teams that make better decisions usually treat customer satisfaction metrics as a set of tools for different questions: interaction quality, customer effort, loyalty, repeat contact, and retention. That distinction matters more than most guides admit.
A familiar pattern shows up in fast-growing communities. Moderators and support agents spend all day answering account questions, handling bug reports, calming angry users, and redirecting repeated requests. The team is clearly busy. Users are clearly talking. But nobody can say with confidence whether the support experience is improving, holding steady, or subtly deteriorating.
That becomes a real problem once the team needs to justify headcount, prove that automation is helping, or explain why one channel feels harder to manage than another.
A support inbox can feel active and still be unhealthy. Public channels often hide this because helpful answers are visible, fast-moving, and socially reinforced. A user may get a correct answer in Discord, for example, but only after searching old threads, posting twice, tagging a moderator, and waiting through timezone gaps.
That experience doesn't always show up in anecdotal team summaries. It shows up when the team starts measuring what happened after the interaction.
Teams that already track bot and workflow performance through tools like chatbot analytics for support teams usually reach the same conclusion: volume metrics alone don't explain customer experience.
Gut feel is useful for spotting tension early. It's weak for proving patterns, comparing channels, or identifying where a process is actually failing.
Support leaders also run into recency bias. The loudest complaint from this morning gets more attention than the quieter friction affecting hundreds of users over time. A product launch, billing issue, or authentication change can create that kind of distortion fast.
A few things usually follow:
Customer satisfaction metrics don't replace empathy. They make empathy operational. They turn “users seem annoyed” into something a team can track, segment, and act on.
Most customer satisfaction programs still revolve around CSAT, NPS, and CES. That part is standard. SurveyMonkey notes that customer satisfaction measurement has become a standardized practice around these three metrics, with CSAT commonly calculated as (number of satisfied responses / total responses) × 100, NPS calculated as % of promoters − % of detractors, and CES typically calculated as the average of effort ratings in lightweight survey formats that can be benchmarked over time and across channels (SurveyMonkey's guide to customer satisfaction KPIs).
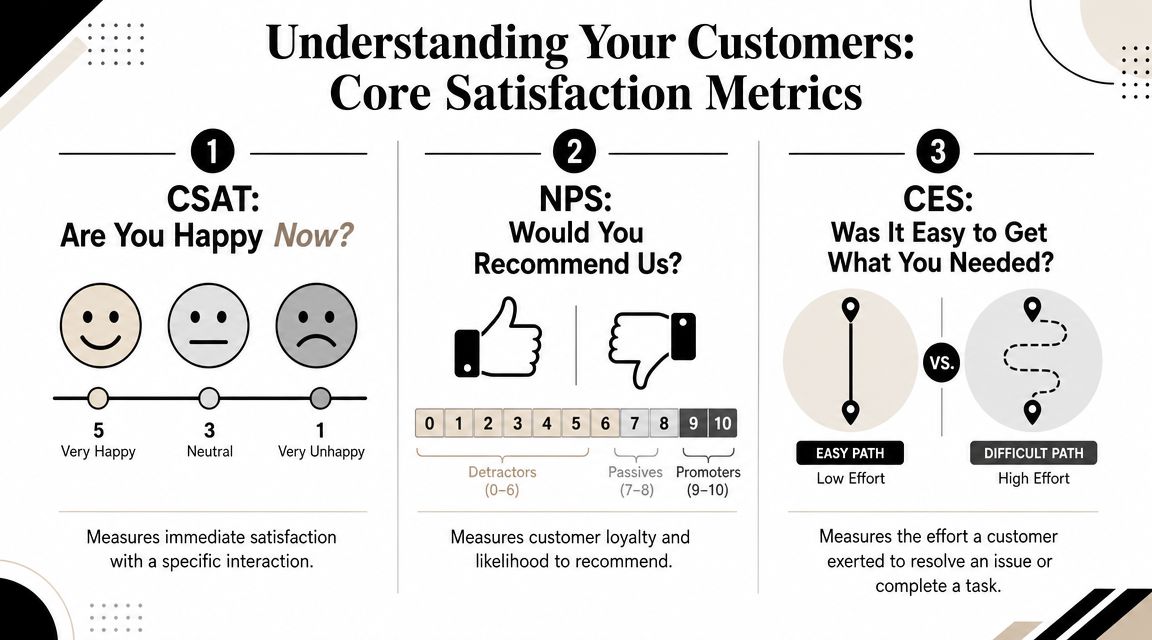
Customer Satisfaction Score, or CSAT, is the closest thing to a thumbs-up or thumbs-down on a specific interaction.
A support team might ask it after a ticket closes, after a refund is processed, or after a moderator resolves an account issue. The core question is usually some version of “How satisfied were you with this interaction?” Industry guidance commonly uses scales such as 1–5, 1–7, or 1–10, then counts satisfied responses as a percentage of total responses.
CSAT is useful because it answers a very narrow question well: did this interaction feel good enough to the customer?
That makes it strong for agent coaching, queue quality checks, and post-resolution monitoring. It's weak when teams try to stretch it into a loyalty metric.
Net Promoter Score, or NPS, asks a broader relationship question. The classic version is whether the customer would recommend the company to someone else.
That's not really a support score. It's a brand and relationship score. Product quality, pricing, trust, reliability, onboarding, and support all influence it. Support can move NPS, but support rarely owns it alone.
This is why NPS works better for leadership reviews and broader customer relationship tracking than for evaluating a single ticket flow.
Customer Effort Score, or CES, asks how hard the customer had to work to get something done.
That sounds simple, but it captures something support teams often miss. A user can be satisfied with the final answer and still feel that the process was annoying. They had to repeat context, switch channels, verify information twice, or wait through multiple handoffs. CSAT may stay fine in that scenario. CES usually catches the friction.
For community-led support, CES is often the most revealing metric when the team wants to understand whether the workflow itself is clean.
MetricWhat It MeasuresTypical QuestionBest ForCSATSatisfaction with a specific interactionHow satisfied were you with this support experience?Ticket closure quality, agent review, interaction monitoringNPSWillingness to recommend, as a proxy for broader loyaltyHow likely are you to recommend us to a friend or colleague?Brand relationship tracking, leadership reporting, broader loyalty trendsCESEffort required to complete a task or solve a problemHow easy was it to get the help you needed?Process friction, handoff problems, self-service and automation quality
Working rule: If the question is about a single support interaction, start with CSAT. If it's about friction, start with CES. If it's about the overall relationship, use NPS.
Survey scores matter, but they don't tell the whole story. Support teams see satisfaction in the operating data too. Drive Research describes a major shift from broad surveys toward operational experience metrics tied to retention and resolution, where CSAT is used after specific events like support tickets, CES tracks ease of task completion, and churn or retention rates connect satisfaction to business outcomes (Drive Research on key customer satisfaction metrics).
A customer doesn't experience a dashboard. They experience waiting, repetition, clarity, and resolution. That's why operational data often acts as an early warning system.
Three signals matter especially for community and support teams:
A high CSAT score loses meaning if users repeatedly wait too long, reopen the same issue, or disappear after “successful” support.
Teams using AI support, bots, or knowledge-base deflection should watch another layer of operational metrics. It's not enough to know that automation handled a conversation. The better question is whether automation reduced effort or just absorbed volume.
A workflow that closes easy requests quickly can improve the support experience. A workflow that traps users in loops usually does the opposite, even when queue counts look cleaner on paper.
That's why response-time reporting matters most when paired with customer feedback. A useful starting point is a support operations view such as response time benchmarks and improvement tactics for customer support, then comparing those trends with post-interaction satisfaction.
A practical operating view usually combines these signals:
A support team shouldn't ask whether the score is good in isolation. It should ask what changed in the workflow when the score moved.
A support lead reviews the dashboard on Friday and sees CSAT up three points. Good news, until Monday brings the same backlog, the same repeat contacts, and the same complaints about a confusing workflow. The formula was right. The interpretation was wrong.
The math is simple:
The harder part is deciding what question each metric should answer.
For CSAT, many support teams count top-box responses as "satisfied." For CES, the useful view is the average score by workflow, channel, or issue type, then the change after a process update. For NPS, the score belongs at the relationship level. It does not belong in an agent performance review.
Teams often ask what a good score looks like. That question matters less than people think.
The first benchmark should be your own baseline. Compare chat CSAT this quarter to chat CSAT last quarter. Compare CES before and after a new bot flow. Compare enterprise accounts to self-serve users only if the journey is meaningfully different. That is how satisfaction metrics turn into operating signals instead of dashboard decoration.
Survey timing matters too. As noted earlier, event-triggered surveys are more reliable because the customer is rating a specific interaction they can still remember clearly. That matters most for CSAT and CES, which are supposed to measure a recent experience, not a vague impression from the last six months.
A score matters when it helps the team isolate what changed in the experience.
The common failure is not bad arithmetic. It is using the wrong metric for the wrong time horizon.
CSAT, CES, and NPS are not interchangeable. CSAT measures the quality of a specific interaction. CES measures how hard the customer had to work during that interaction. NPS measures the broader relationship and willingness to recommend. If a team treats all three as versions of the same thing, it will tie the wrong score to the wrong decision.
Simon-Kucher makes this distinction clearly: CSAT reflects a specific interaction, CES reflects effort, and NPS reflects broader loyalty. In a multi-channel support operation, the better question is not "What is our score?" It is "Which score helps explain repeat contact, expansion risk, or churn for this customer segment?" (Simon-Kucher on the importance of customer satisfaction metrics).
A practical decision lens looks like this:
Decision you need to makeMetric that fits bestWhyWas this support interaction good enough?CSATIt measures satisfaction with a specific eventDid the process create too much friction?CESIt shows how hard the customer had to work to get helpIs the overall relationship getting stronger or weaker?NPSIt tracks broader loyalty over time
Support teams often misstep in their approach to these metrics. Using NPS to judge an individual agent usually produces noise, because the score reflects product value, brand perception, and prior history far beyond one conversation. Using CSAT to infer long-term loyalty creates a different problem, because a pleasant ticket can coexist with a weak customer relationship. Using CES after a workflow or policy change is often the clearest way to find process friction before it turns into lower retention.
Bad incentive design creates bad support behavior. If managers push agents to maximize score above all else, some teams start nudging users for positive ratings, avoiding difficult cases, or closing tickets before the issue is resolved.
Good benchmarking is stricter than "higher is better." It starts with the decision, picks the metric that fits that decision, and then compares like with like over time.
The biggest customer satisfaction mistakes usually come from oversimplification. Teams want one score, one dashboard tile, and one weekly number to celebrate or fix. Support doesn't work that cleanly.
A rising CSAT can hide a messy experience. Customers often reward friendly agents even when the process around them is clumsy. If they finally get a helpful human after several failed attempts, the final interaction may score well while the end-to-end journey still feels bad.
That's why CES deserves more attention than it gets. Nextiva's guidance argues that Customer Effort Score is a stronger operational metric than simple satisfaction for predicting future experience quality because it measures how hard the customer had to work, and that when CES rises after a change, the root cause is usually measurable in the interaction path itself (Nextiva on customer satisfaction metrics).
Survey fatigue is another self-inflicted problem. If every bot handoff, every resolved thread, and every minor update triggers a survey, response quality drops. So does goodwill.
The fix isn't more survey volume. It's better timing and tighter targeting.
An average score can hide almost everything that matters. One queue may be excellent while another is deteriorating. One channel may create repeat questions because the handoff from public to private support is awkward. One issue type may look fine overall but collapse on weekends.
Useful customer satisfaction metrics are almost always segmented by something operationally real.
Bad incentive design creates bad support behavior. If managers push agents to maximize score above all else, some teams start nudging users for positive ratings, avoiding difficult cases, or closing tickets before the actual issue is resolved.
Satisfaction data should improve service design and coaching. It shouldn't teach the team to game the survey.
Customer satisfaction programs usually break down in execution, not theory. Teams know they should send surveys, review low scores, compare channels, and connect support metrics with workflow changes. The hard part is doing that consistently when support happens across Discord, Telegram, Slack, and web chat.
A unified support setup helps because it keeps the operational context attached to the feedback. Instead of hunting across disconnected tools, the team can review the ticket, the resolution path, the time-to-first-response, and the satisfaction signal together.
A workable setup usually includes four pieces:
One example is Mava, which combines a shared inbox, analytics, AI support workflows, and post-support tracking for teams operating across community channels and web chat. For teams evaluating that style of setup, a useful product walkthrough is this ticket bot dashboard overview.
The practical value comes after collection:
Customer satisfaction metrics stop being a reporting exercise and become a quality-control system for support operations.
Teams often don't need a complex feedback architecture to start. They need a small program that produces reliable signals and creates a habit of acting on them.
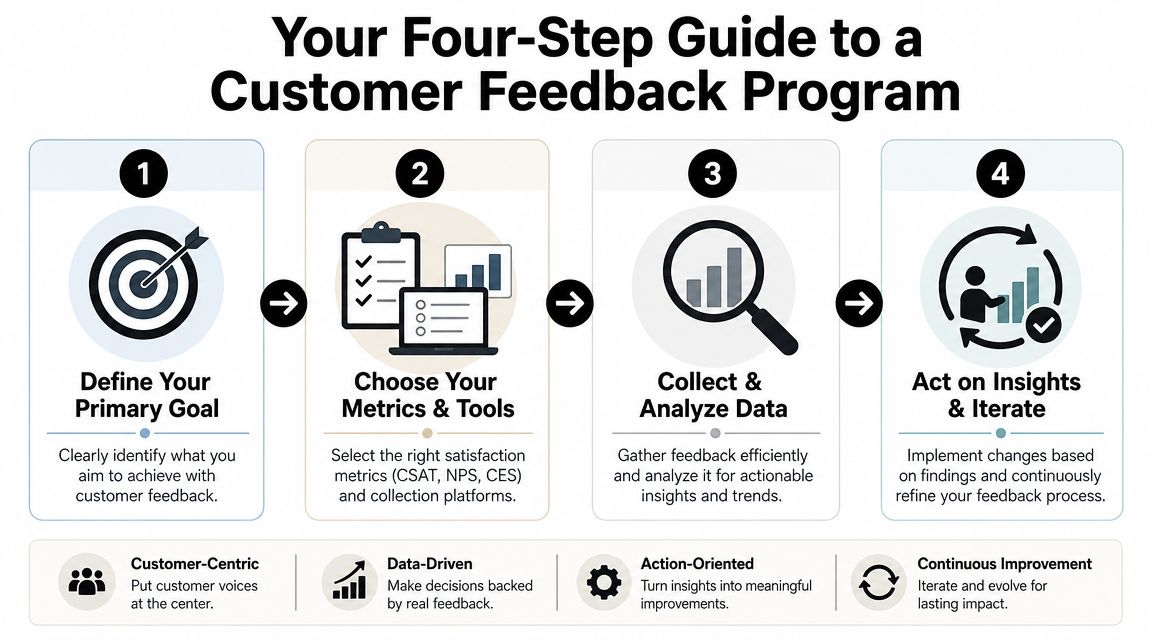
Start with the business question, not the survey.
If the team wants to know whether support interactions feel better, CSAT is a sensible entry point. If the concern is that users are bouncing between channels or repeating themselves, CES is usually the better fit. If leadership wants a broader pulse on customer loyalty, that points toward NPS.
A weak goal sounds like “track satisfaction.” A useful goal sounds like “reduce effort in account recovery” or “monitor ticket quality after bot handoff.”
The survey should match a real event in the customer journey. Ticket closure, successful purchase, self-service completion, and refund resolution are all cleaner trigger points than calendar-based survey blasts.
Keep the collection method light. One primary question is often enough. Add an optional comment box so the team has context when a score drops.
This short walkthrough can help teams think about implementation in a practical sequence:
Feedback programs fail when agents think the score exists only to judge them. The team needs to know what the metric is for, what it isn't for, and how managers will use it.
A few points should be explicit:
A feedback program only works if someone reviews the signals consistently and changes something in response.
That review rhythm doesn't need to be complicated:
The first version of a feedback program should be narrow, event-based, and easy to maintain. Complexity can come later.
Start with the decision you need to make, not the metric you recognize.
Use CSAT if you want to know whether a specific support interaction went well. Use CES if users are getting stuck, bounced between channels, or forced through too many steps. Use NPS if leadership is asking a broader question about loyalty and retention over time.
Those are different time horizons. Treating them as interchangeable is one of the fastest ways to misread what customers are telling you.
Send surveys right after the event you want to measure. If you ask too late, people answer based on a fuzzy overall impression instead of the actual interaction.
For support teams, that usually means after a case is resolved, after a private handoff is completed, or after a moderation decision is closed. The rule is simple. Match the survey timing to the question. Interaction quality needs an immediate trigger. Brand loyalty can be measured on a separate cadence.
Community support needs tighter survey rules because conversations sprawl.
In Discord or Telegram, ask for feedback after a defined outcome, such as ticket closure, escalation completion, or a resolved account issue. Do not ask after every reply in a thread. That creates noise and survey fatigue, especially in public channels where several topics can overlap in a few minutes.
It also helps to report public and private support separately. Public threads often reward speed and visibility. Private conversations give you a cleaner read on effort, clarity, and resolution quality.
Collect both.
A score shows where to look. A comment explains what happened, whether that was a slow handoff, an unclear answer, or a policy the user hated. Teams that only track averages usually miss the operational fix.
For founders or operators building a broader culture around feedback, this guide for entrepreneurs on feedback is a useful complement to support-specific measurement work because it focuses on how organizations can absorb criticism and use it productively.
Review results often enough to catch patterns before they become habits.
Weekly works for many support teams. Biweekly can work if ticket volume is lower. The key is to review scores alongside comments, channel mix, issue type, and operational context. A dip in CSAT means something very different if it happened during a backlog spike than if it happened after a policy change.
Mava helps community and support teams manage conversations across Discord, Telegram, Slack, and web chat in one place, while tracking operational support data and post-support satisfaction signals that make customer satisfaction metrics easier to act on. Teams that want cleaner workflows, event-based feedback collection, and visibility into response, resolution, and AI support trends can explore Mava.